
It’s Time to Rethink Lineups
Old school is out; baseball managers should start utilizing sabermetrics to determine their batting lineups.

Terry Collins sighs, sitting alone in his office. An empty lineup card sits before him. He’s spent the past hour puzzling over who to bat today, and where — should Cespedes bat cleanup, or would he fit better in the 3 hole? Does Jose Reyes deserve to lead-off? And where on Earth does Jay Bruce fit into any of this?
Suddenly, over his left shoulder, he hears a voice. “Bat Reyes lead-off,” it says. Startled, Collins peers over his shoulder to find a tiny devil-esque figure, who bears a remarkable resemblance to Chris Russo. “Speed is important in the top of the lineup!” The devil says.
From his right shoulder, another voice speaks up. “OPB is most important,” it insists, “Put Granderson leadoff!” Looking over, Collins observes a tiny angelic figure sitting on his opposite shoulder. This one looks just like Eno Sarris.
For years, there’s been a fairly standard way to setup lineups. Managers bat their fastest guys first, put the guy who can hit for power in cleanup, bat the pitcher ninth, etc. It hasn’t changed for almost a century, so why start now?
Sabermetrics begs to differ. Based on probabilities of runners getting on base and being advanced by other hits or walks, a manager can maximize the numbers of runs per game that they get out of the same roster. By minimizing the number of players left on base, a manager maximizes runs scored.
It’s mind-numbing to think that simply re-ordering lineups in a particular way to score more runs is possible, but no manager really does so. While sabermetrics may have infiltrated the front offices of baseball teams everywhere, thanks to Billy Beane and Moneyball, it appears to be lagging behind in the dugout.
Here’s why managers should rethink the old-school way of lineups.
The Superior Logic Behind Sabermetric Lineups
Sabermetric lineup creation, much like sabermetrics as a whole, is based on plenty of math. To maximize run creation, a good lineup should create opportunities for runs — i.e. getting runners into scoring position — and then give those opportunities to the players who can best take advantage of those opportunities.
Old school lineups don’t quite have as solid of a logical foundation. These lineups seem to be based around a particular scenario, as this article describes: the leadoff hitter singles to start out the game, he steals a base, the 2/3 batters either knock him in or advance him another base, and then the cleanup hitter slams a home run to bring everyone home. It’s a nice idea, but basing the entire lineup around this single scenario, one that only truly aligns at the start of a game, doesn’t really make sense. Instead, a lineup should be built to consistently score runs throughout the game — not just right at the start.
Determining Sabermetric Lineups
To create a basic sabermetric lineup, one needs only two things: OBP and SLG. OBP is valuable in creating lineups because OBP indicates two things: 1) how frequently a player will create run-scoring opportunities by getting on base, and 2) how frequently a player can take advantage of run-scoring opportunities by advancing runners or scoring then. SLG is useful in that it tells how easily a player can take advantage of a run-scoring opportunity — a player with a high SLG is more likely to score someone on first base than someone with a low SLG.
To maximize run scoring potential, a lineup should create as many run scoring opportunities as possible, and then capitalize on them. For instance, a leadoff hitter should have one of the best OBP on the team, because as the leadoff hitter, he bats the most often, and thus gets the most opportunities to get on base and create run scoring opportunities. Speed doesn’t have to be a factor. In fact, most of the top of the order should get on base frequently — be it from hits or walks.
The cleanup hitter, in this sabermetric lineup, comes up to bat frequently with runners on base ahead of him. The best hitter on the team should be batted here, because he should be able to take advantage of all of those opportunities placed in front of him. Say that the batter ahead of him singled — a single likely won’t score the runner, but a double might — this is where having both a high SLG and a high OBP comes into play.
What’s the impact between Sabermetic and traditional lineups?
There’s a definite, tangible impact by setting up a lineup according to sabermetrics, instead of tradition. To illustrate this point, let’s make the 2016 Dodgers, already a great team in their own right, even better.
Here is a sample lineup for the Dodgers, based off of the Dodgers’ lineup from July 1, 2016 (replacing Trayce Thompson with Joc Pederson, who played in far more games, and batted in a similar slot throughout the season).
- Chase Utley, 2B
- Corey Seager, SS
- Justin Turner, 3B
- Adrian Gonzales, 1B
- Howie Kendrick, LF
- Yasiel Puig, RF
- Joc Pederson, CF
- Yasmani Grandal, C
- Pitcher
Assume that the Dodgers rolled out this exact lineup, every day, for 162 games. Using each player’s individual OBP and SLG (and using the OBP and SLG of all Dodgers pitchers averaged together), and using Baseball Musings’ lineup analysis tool, one can calculate that the above lineup could expect to score 4.420 runs per game, or 716 runs over the course of the year. This is very close to the actual figure of 725 runs scored by the Dodgers in 2016, so the above lineup matched (in general) what the Dodgers were rolling out every day in 2016.
- Adrian Gonzales, 1B
- Corey Seager, SS
- Chase Utley, 2B
- Justin Turner, 3B
- Joc Pederson, CF
- Yasmani Grandal, C
- Yasiel Puig, RF
- Pitcher
- Howie Kendrick, LF
Suddenly, Gonzales is batting leadoff, the pitcher is batting eighth, and Turner is hitting cleanup. According to the tool, this lineup would expect to score 4.723 runs per game, or 765 runs over the course of the season. That’s a forty run increase over the actual figure. Sabermetrics considers 10 runs as a win, as a rule of thumb, so rolling out a sabermetric lineup would have won the Dodgers 4 more games than they did in 2016, on average.
Obviously, the Dodgers didn’t need those wins, as they clinched the NL west with ease, but given how close the wild-card races were last season, four wins could be the difference between playing in the playoffs and watching them at home for some teams.
There’s a measurable impact by following sabermetric guidelines for lineup construction. It’s not difficult — the tools are there. The only thing stopping this from becoming widespread is the “old school” nature of managers — hopefully a “Moneyball”-esque revolution for the dugout instead of the front office.
About the Creator
John Edwards
Staff Writer for The Unbalanced, Contributor at Sporting News.
Keep reading
More stories from John Edwards and writers in Unbalanced and other communities.
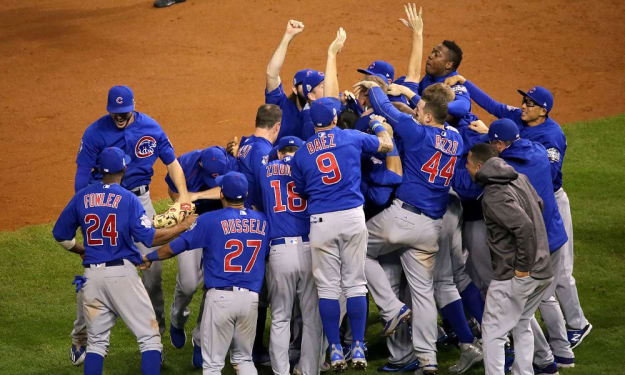
The Chicago Cubs Are the World Series Favorites
Make no mistake: the Dodgers are a great team. They have Clayton Kershaw, the pitching equivalent of Mike Trout. They have Corey Seager and Justin Turner, two of the best infielders in the National League. They have Kenley Jansen, a lights out closer who has been nothing short of dominant throughout his career. And yes — as my colleague Dylan Svoboda pointed out — they’re predicted to be better (though by a fairly slim margin) than the reigning WS Champs, the Chicago Cubs.
By John Edwards7 years ago in Unbalanced
Somers Falls 3-2 in Season Opener
On Monday April 1, Somers opened their baseball season versus Ardsley, and Coach JT Genovese wasn’t going to fool himself with his new roster. “We have a very young team, and we’re going to have to work through some bumps,” he said. A good first showing nonetheless, the Tuskers still came up a little short.
By Rich Monettiabout 15 hours ago in Unbalanced
John Jay gets First Win with Comeback Victory over Fox Lane
See tip, pledge and subscribe bottons On Wednesday March 27, the Wolves fell behind 3-0 to visiting Fox Lane in the first inning. Nonetheless, starter Julia Neumann kept the score contained and preserved the chance for a comeback win. A 4-3 seventh inning lead for Jay coming around, Skye Volpicella couldn’t put the squeeze on Gaby Naar’s long fly ball to lead off the inning. So reliever Maria DeGataeno simply stuck to the program. “It’s just, next play, forget about it,” said the freshman, and the relief pitcher did exactly that.
By Rich Monetti3 days ago in Unbalanced
Before Sylvester the Cat, there was Sylvester the Dog
Sylvester was a Merrie Melodies canine Sylvester, the Cat, is a beloved Looney Tunes character who debuted in March 1947 in the animated short Life with Feathers. The iconic Mel Blanc once said that he enjoyed voicing Sylvester, one of his favorite characters. The cartoon short that was near and dear to Blanc's heart was Bird's Anonymous which starred the popular cat.
By Cheryl E Preston4 days ago in Geeks


Comments
There are no comments for this story
Be the first to respond and start the conversation.